Every output DIALux evo produces — and what a Singapore homeowner can actually appreciate.
A buyer-side catalogue of the 13 distinct visual deliverables the world's leading lighting-design software (DIAL GmbH, Lüdenscheid) generates from a model. For each output we document what it looks like, what it measures, how much expertise it demands, and how readable it is to a non-technical HDB renovation customer browsing fixtures on bshsg.com.
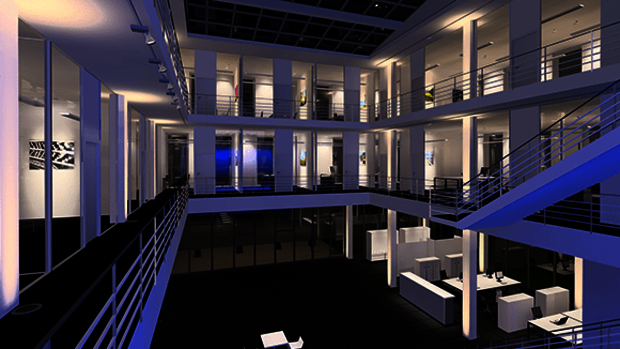
Output 01 · Hero asset for buyersPhotoreal raytrace renders
Static, camera-fixed images produced by DIALux's raytracer. Diffuse + mirror reflectance + transparent materials are physically simulated. Output formats include PNG/JPG and 32-bit HDR EXR.


What it measures
Nothing numeric. It is a faithful visualisation of colour temperature, beam spread, reflection, shadow softness and mood. The render reads the same physical luminaire data (IES / EULUMDAT) and same surface reflectances DIALux uses for its calculations, so what the buyer sees is photometrically truthful — not Pinterest-fiction.
Reading effort
Zero. The image looks like a 3D-rendered interior. Anyone can interpret it.
Catch
Renders are static (no real-time navigation). For a website you produce 3–6 fixed camera angles per scene. The HDR (.exr) variant lets a graphic designer push the look further in Photoshop without re-running the calculation.
Layperson takeaway
"Oh — so that's what my living room looks like with this fixture vs. that one." A side-by-side render (e.g. 3000K cove vs. 4000K downlights) instantly communicates a decision a homeowner could never read off a datasheet.
Singapore buyer angle
Most HDB and condo buyers today pick fixtures from product photos that show only the fixture, not the room. Raytrace renders flip this: they show the buyer's space with the buyer's choice in it. Strong differentiator vs. Shopee/Lazada listings.
Verdict
Tier-A. This is the single deliverable that converts an electrical-contractor offer into a designer offer. Lead the bshsg.com proposal flow with this.
Output 02 · Designer's draft viewReal-time OpenGL CAD view
The default 3D viewport. Uses pre-baked light textures rather than raytracing. Updates instantly as you move fixtures, rotate the camera, or change materials. Faster but flatter than the raytrace pass.

What it measures
Same physics as raytrace but rendered with pre-baked light textures — so reflections in mirrors and refraction through glass are not simulated, but the illuminance distribution on opaque surfaces is correct.
Why it matters
You can fly through the model live. The designer iterates here, then runs raytrace only at sign-off.
Layperson takeaway
Looks like a video-game preview of their flat. Less polished than the raytrace, but it allows live walkthroughs — useful in a showroom or screen-share consultation.
Verdict
Tier-B. Useful as a sales-call screen-share for interactive "see what your room feels like" demos, but the finished raytrace render is the public-facing asset.
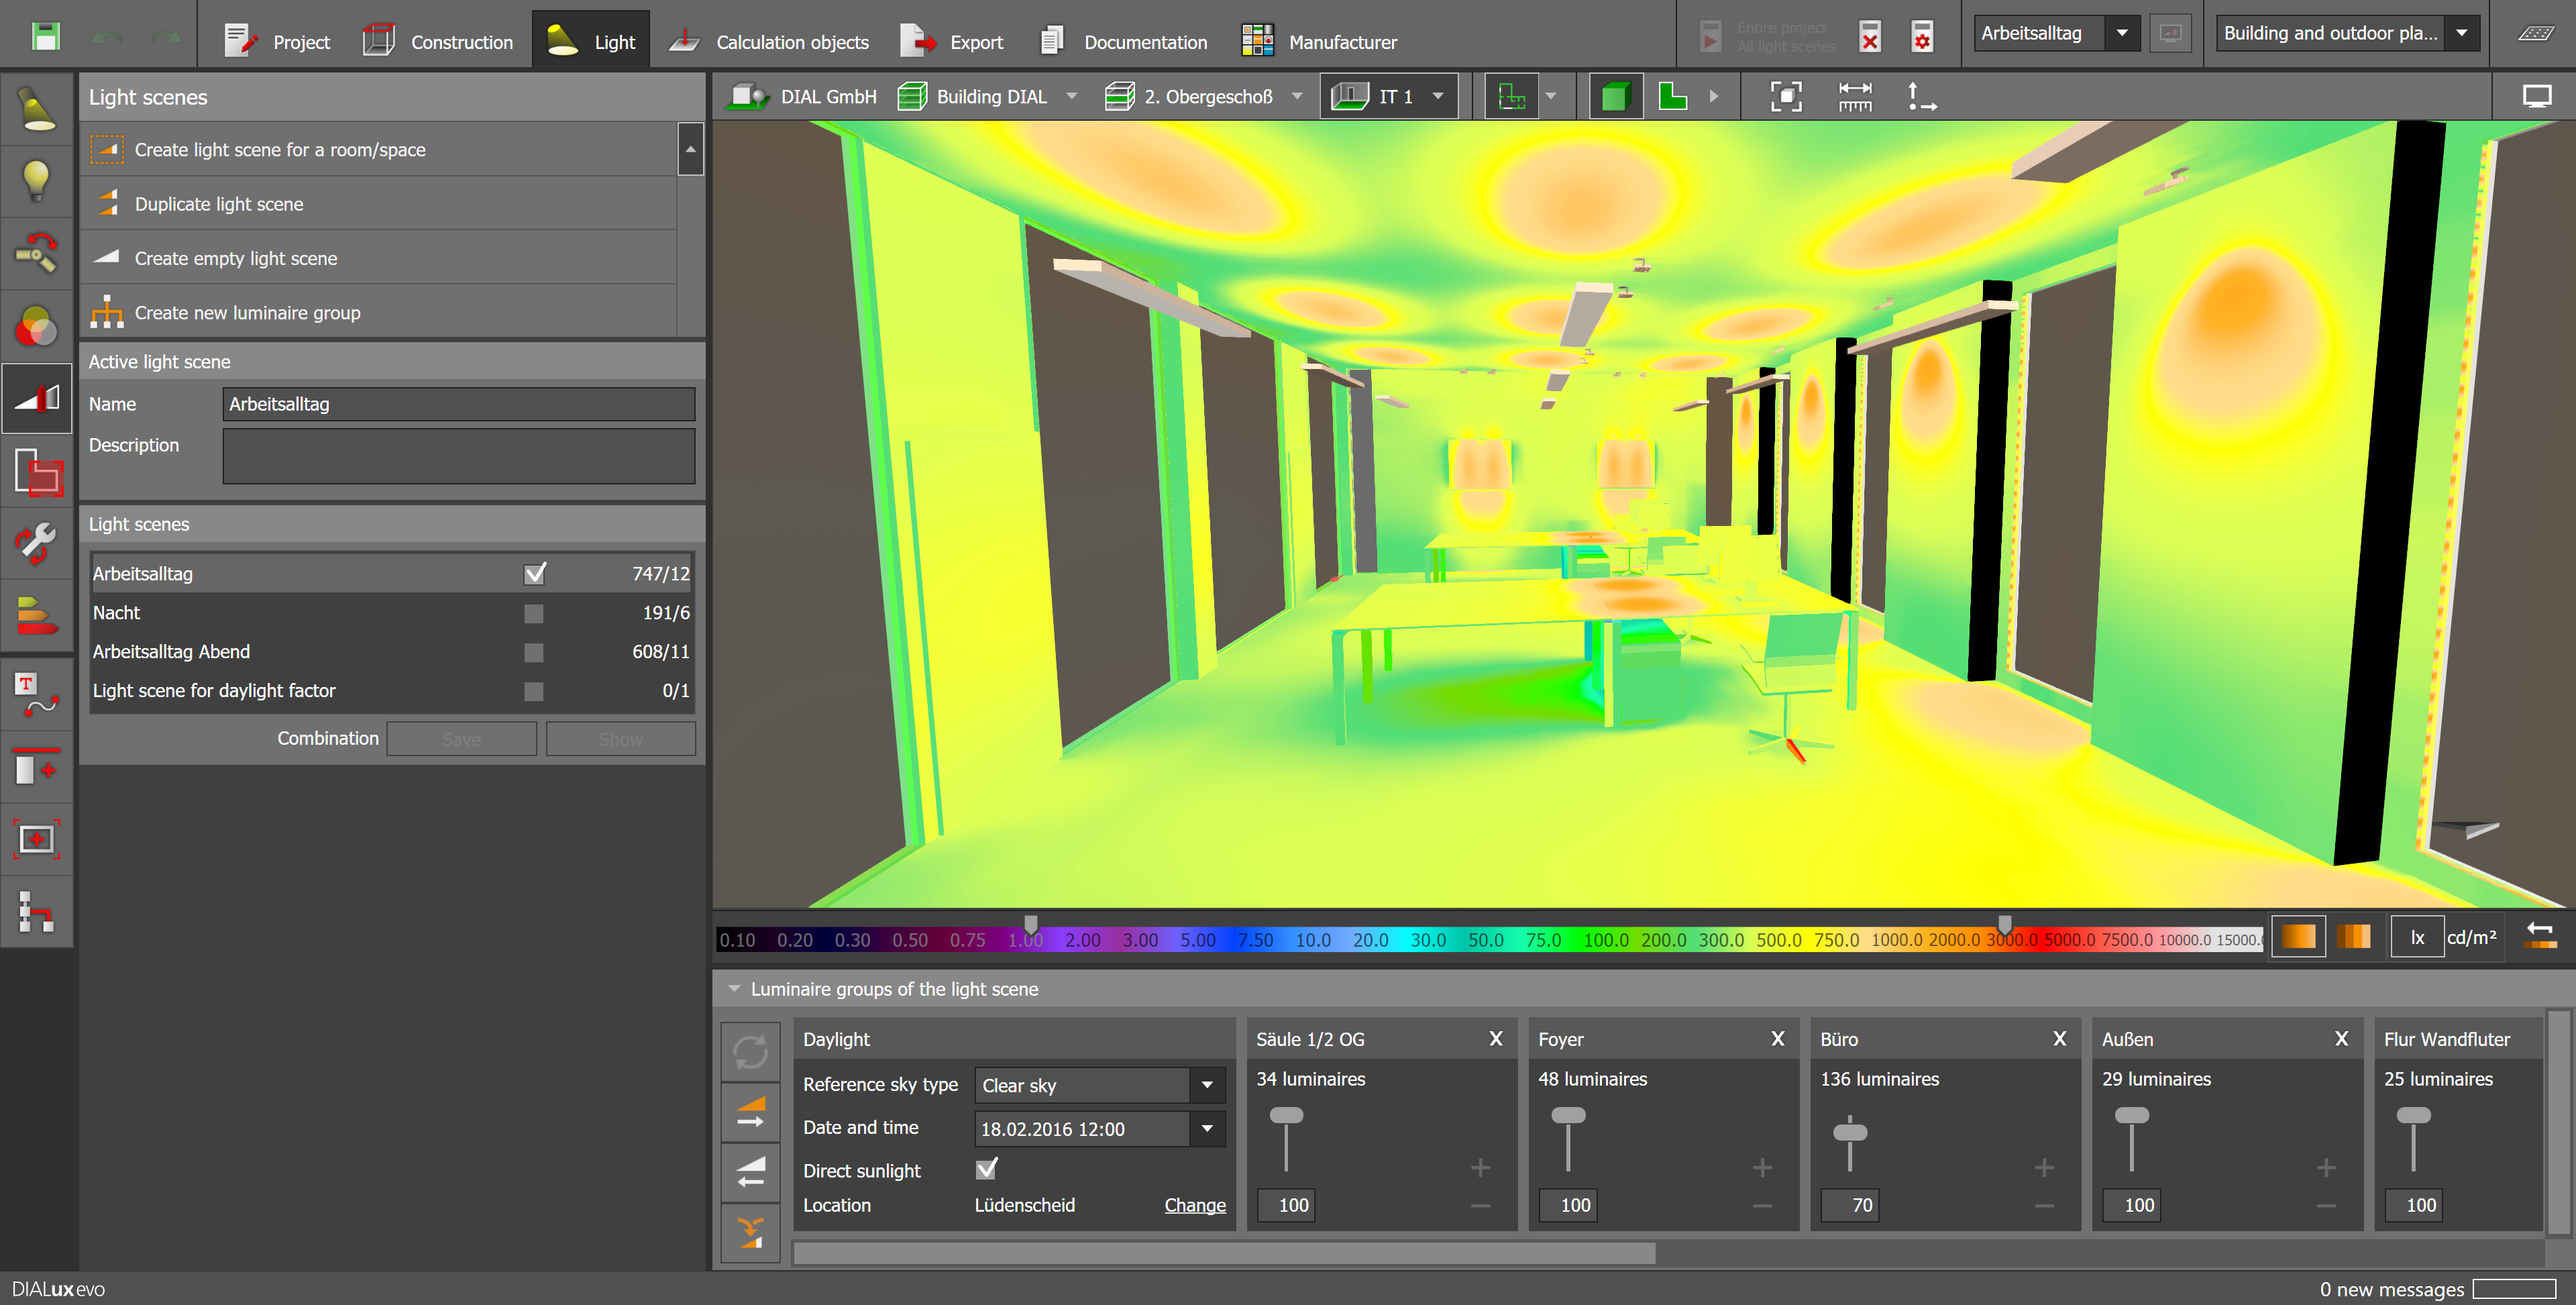
Output 03 · The "is it bright enough?" pictureFalse-colour illuminance maps
Heat-map style overlay where each pixel of the floor / desk / wall is coloured by lux level. DIALux uses a 27-step colour scale spanning three ranges (low / medium / high) so the same key works for outdoor, indoor, and accent-lighting scenes.


What it measures
Illuminance (E, in lux) on calculation surfaces, or luminance (L, in cd/m²) on real surfaces. The legend ties colour to numeric value. DIALux KB: "the false-colour view helps to interpret the calculation results quickly and easily."
Reading effort
Light: you need to grasp that red = bright, blue = dim, and you need to remember the standard (e.g. 300 lux for living rooms, 500 lux for kitchens / desks).
Layperson takeaway
"I can see the dark corner." A homeowner who has never read DIN 5035 can still point at the blue patch by the dining table and say "I don't want that". The colour ramp turns abstract lux numbers into a literal picture of bright vs. dim.
Singapore buyer angle
HDB living rooms typically have one ceiling point and miss the dining counter and the sofa-reading zone — a false-colour map of "your current setup" vs. "what BSH proposes" is brutally clear without needing a single number.
Verdict
Tier-A. Best "engineering credibility" deliverable that still reads at a glance. Pair it with the raytrace render side-by-side for maximum impact.
Output 04 · The contour mapIsolux contour lines
Like a topographic map, but for light. Lines join points of equal illuminance. Dense lines = sharp gradient (uneven lighting). Wide spacing = uniform lighting. Toggled with F6 in DIALux.


What it measures
Same data as false-colour, drawn as line contours rather than colour bands. A sector with very dense curves represents an area with pronounced differences in illuminance; ample spacing indicates uniformity.
Layperson takeaway
Less intuitive than false-colour for a non-engineer. Looks like a "weather map". A buyer can grasp the concept ("rings = unevenness") but won't appreciate it without a guide.
Verdict
Tier-B. Standards-compliance pages need this. Skip it in marketing collateral — false-colour does the same job more legibly.
Output 05 · The "brightness as the eye sees it"Surface luminance maps (cd/m²)
Unlike lux (light hitting a surface), luminance is light leaving the surface — i.e. what the eye actually perceives. Road and screen designers care about this; offices need it for ceiling and wall surfaces.


What it measures
Candela per square metre — the perceived brightness of a surface, accounting for both incoming light and surface reflectance. Critical for ceiling-luminance limits (offices), façade lighting, and roadway luminance (M-class roads in Singapore highways are specified in cd/m², not lux).
Layperson takeaway
Useful narrative ("a black floor needs more lumens than a white floor for the same perceived brightness") — but the raw cd/m² map looks similar to a false-colour lux map and the unit confuses non-specialists.
Verdict
Tier-C for residential buyers, Tier-A for commercial / road tenders. Mention as a narrative ("DIALux even simulates how bright surfaces look, not just how much light they receive") but don't put cd/m² figures in front of HDB owners.
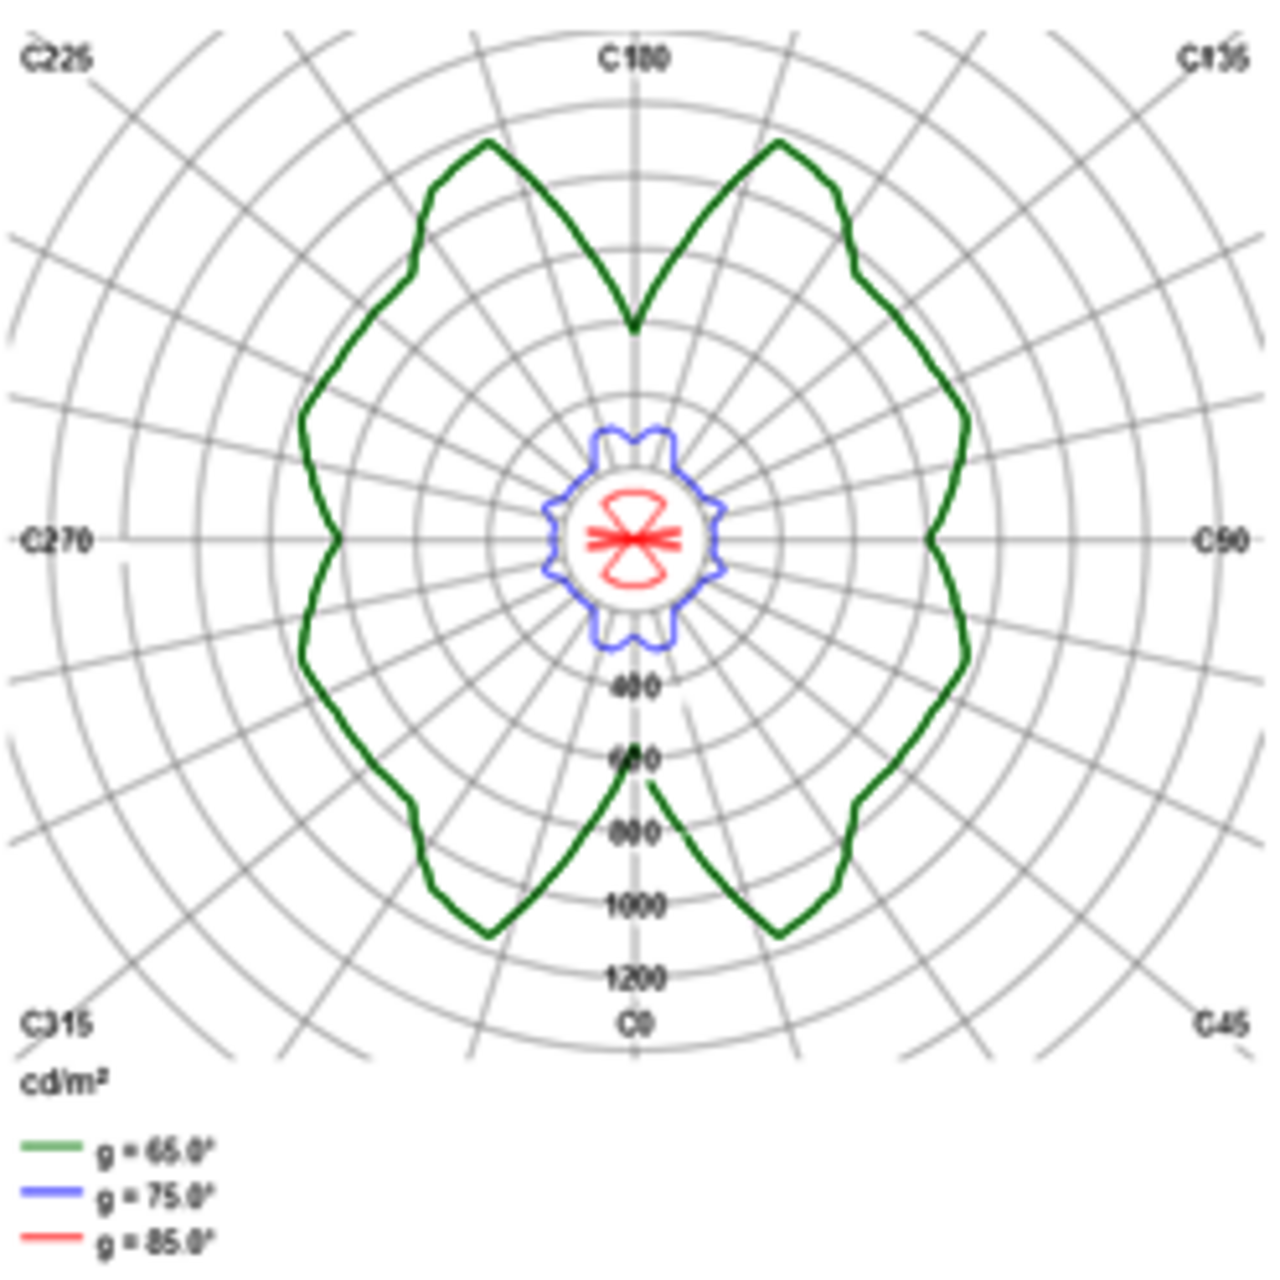
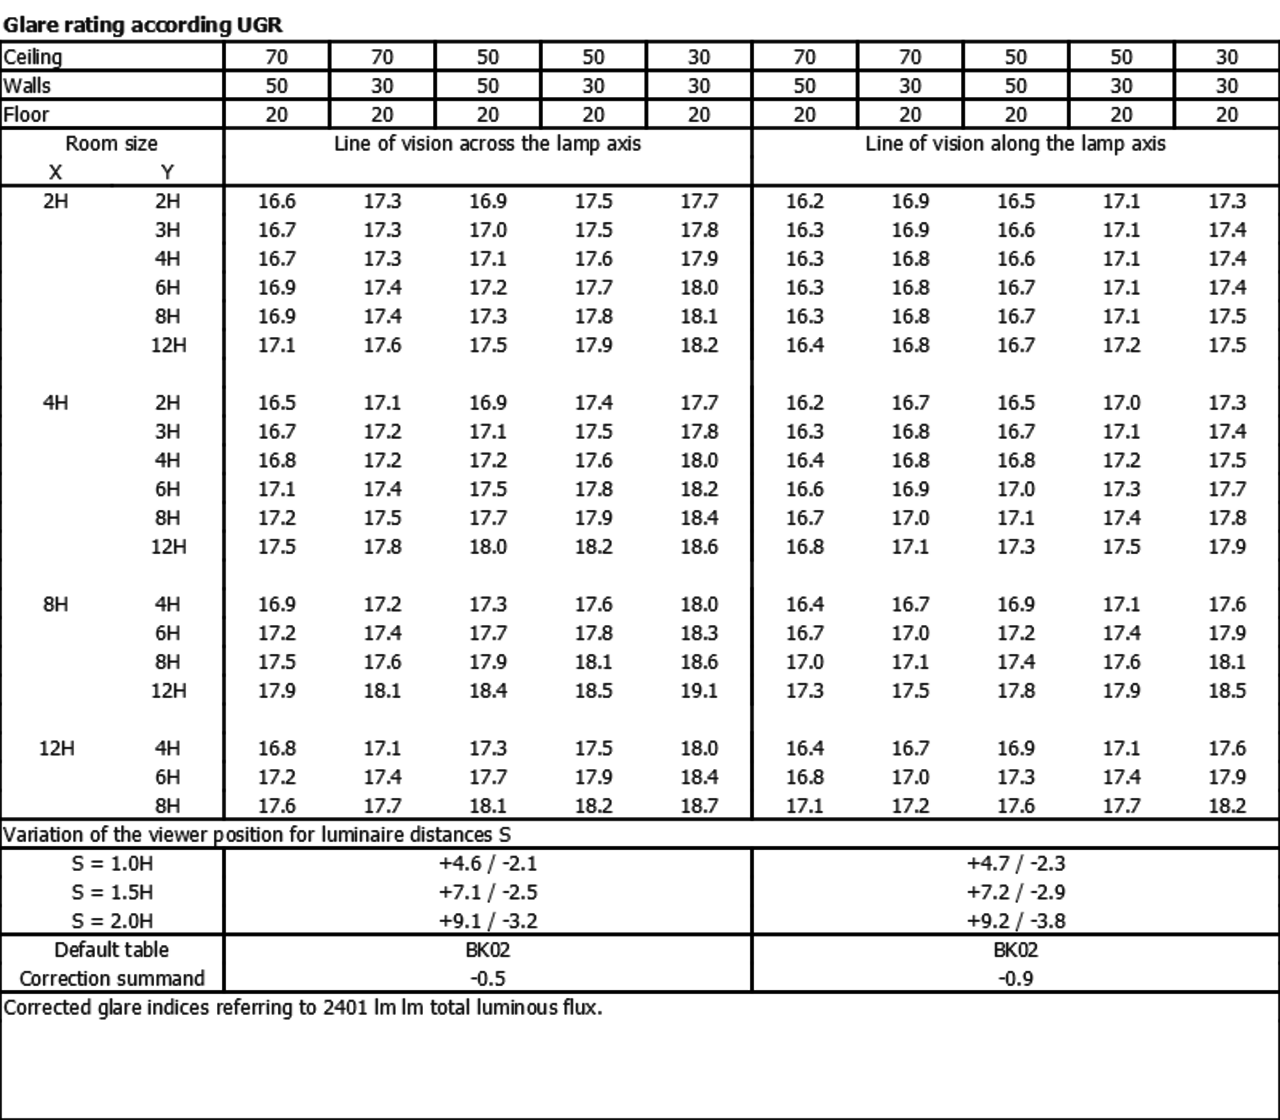
Output 06 · The glare reportUGR (Unified Glare Rating) zones & diagrams
UGR is the European glare metric. Values 10 = no glare, 19 = office-acceptable limit, 30 = unacceptable discomfort glare. DIALux can place virtual observers around the room and compute UGR for each viewing direction.


What it measures
Discomfort glare from luminaires for a seated observer. Each observer point gets a rosette diagram: each spoke represents a sight direction, and DIALux flags red on every direction where UGR > the chosen limit (typically 19 for offices, 25 for industrial).
Why it matters
The single most under-appreciated lighting failure in Singapore offices and F&B is glare from bare LED downlights. UGR is the calculation that catches it before installation.
Layperson takeaway
The rosette diagram is unintuitive. But the story — "we placed virtual people at every seat and checked whether any light fixture would blind them" — is incredibly compelling. A green-vs-red rosette comparing "cheap downlight" vs. "deep-recessed downlight" lands hard.
Verdict
Tier-B with explanation. Worth a one-page "glare audit" block for office & F&B leads. Skip it for HDB ceiling-fan-light buyers.
Output 07 · The engineer's gridWorking-plane value grids & numerical tables
DIALux divides the workplane (default 0.85 m above floor) into a regular grid and reports the lux value at every point, plus the summary: average (Eav), minimum (Emin), maximum (Emax), and uniformity (Uo = Emin/Eav, U1 = Emin/Emax).


What it measures
Service illuminance compliance with EN 12464 (Singapore offices follow this) or SS 531 (Singapore code-of-practice for indoor workplaces). The minimum value matters as much as the average — a corridor that averages 200 lux but dips to 50 lux at the entry would fail.
Layperson takeaway
A wall of three-digit numbers in a grid. Nothing for a homeowner to take away. But for a procurement officer at an office or restaurant fit-out, this is the evidence that lighting meets code.
Verdict
Tier-C for consumers, Tier-A for tender packs. Keep in the PDF appendix; not on the product page.
Output 08 · The "sunlight study"Daylight factor maps & sun-path
DIALux selects a CIE sky model (overcast / average / clear) and a date+time, then computes daylight factor on a 0.85 m grid. Direct sunlight is rendered for clear-sky scenes — the sun path drives shadow positions across the day.


What it measures
Daylight factor (D) = (interior horizontal lux) / (exterior unobstructed lux), %. Singapore's Green Mark scheme has daylight-glare and daylight-factor credits — daylight maps are how you prove them.
Visual
Output is a false-colour map across the floor showing D as a percentage. Areas near windows red (5–10 %), deep interior blue (< 1 %).
Layperson takeaway
For HDB residents this is gold: it answers "do I really need the living-room downlights on at 11 am?" A daylight map shaded green near the window and blue 4 metres inwards instantly explains why selective dimming saves electricity.
Verdict
Tier-B and underrated for the Singapore market. Use as a "energy savings storytelling" page alongside daylight-sensor recommendations.
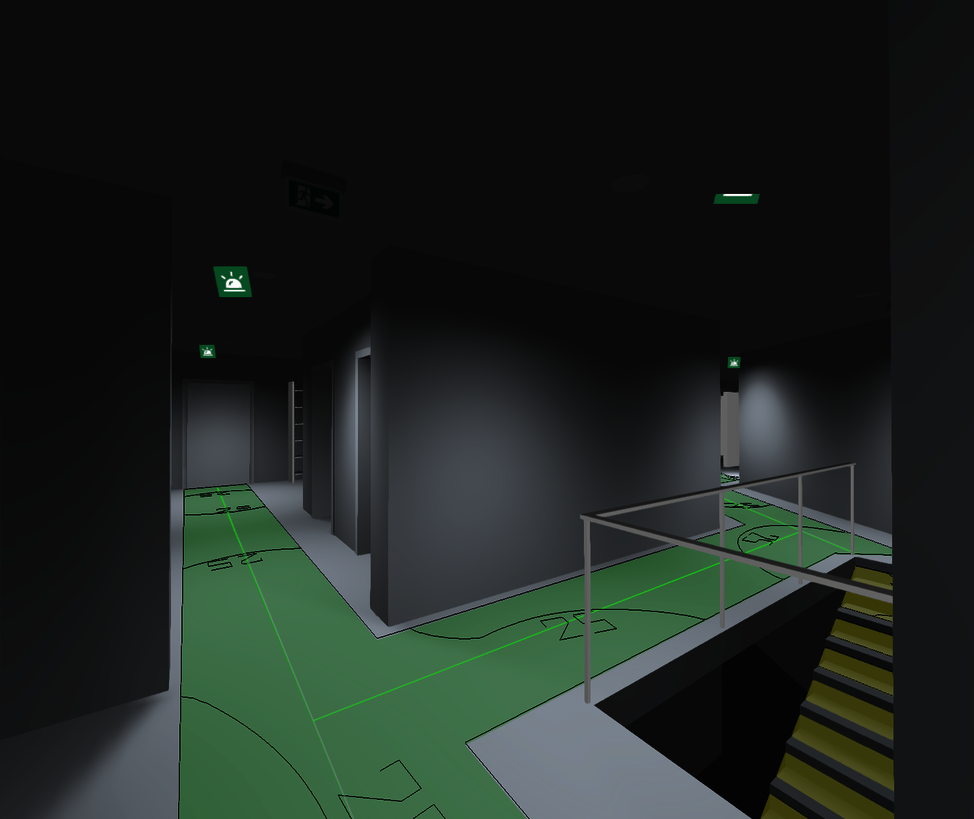
Output 09 · The compliance packEmergency-lighting layouts
Since DIALux evo 10 the tool follows EN 1838 directly. Designers place escape routes as polylines, anti-panic areas as polygons, and DIALux computes minimum lux on-the-floor and identifies the under-performing patches in real time.
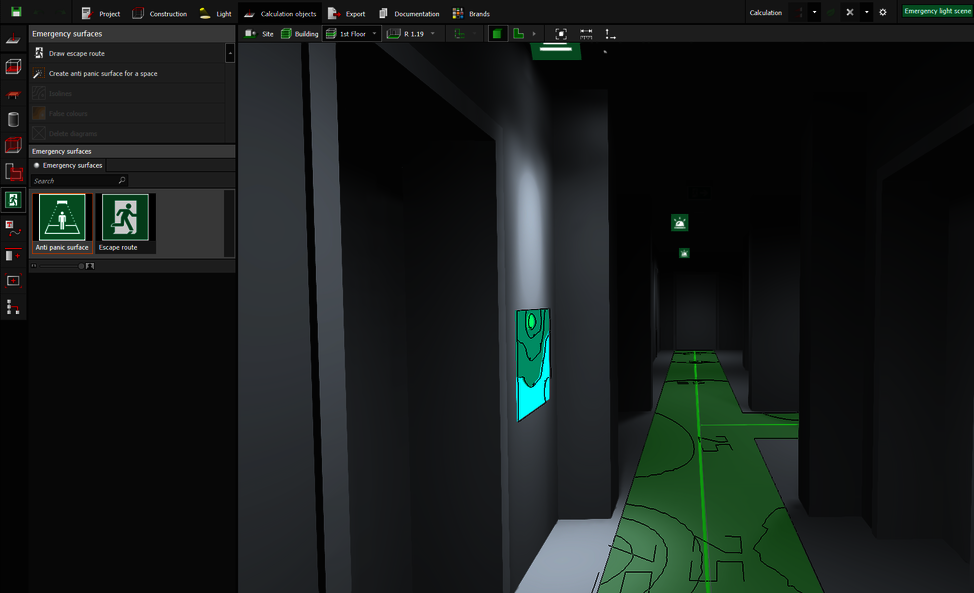
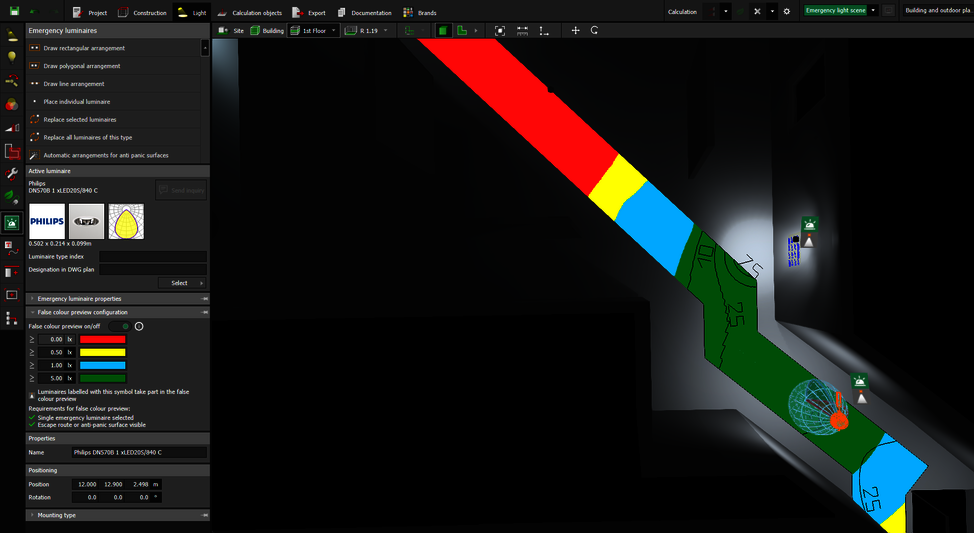
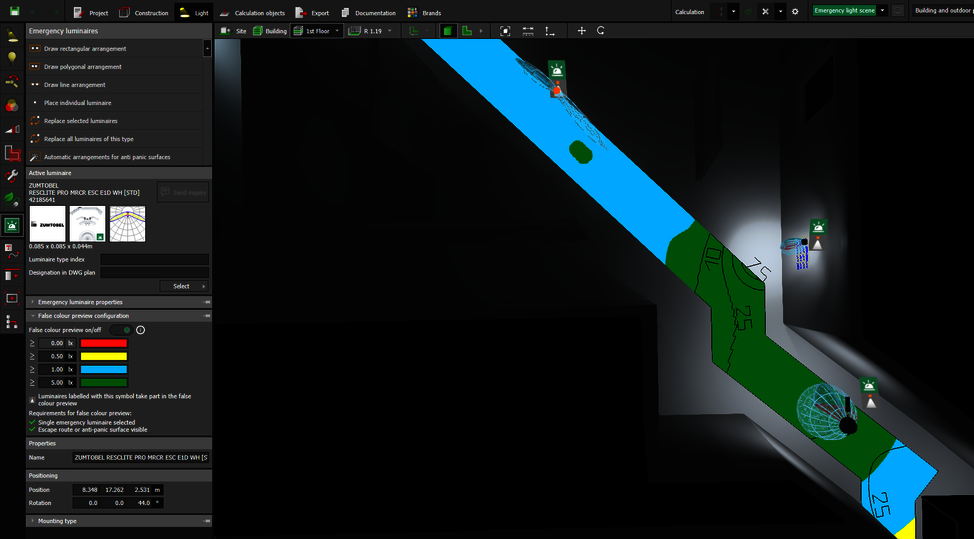

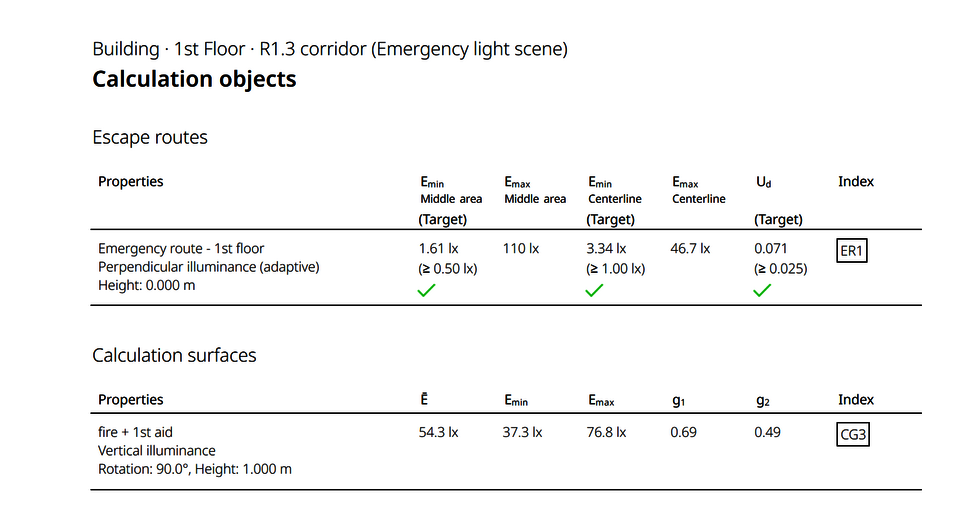
What it measures
EN 1838 / SS 563 emergency-lighting compliance: minimum 1 lux on the centre line of escape routes, 0.5 lux on anti-panic floor, 5 lux around fire-fighting equipment.
BSH angle
For office, F&B and retail tenants in Singapore, emergency lighting compliance is statutory. A BSH proposal that includes this study elevates the offer beyond "supply & install" into "code-compliant design".
Layperson takeaway
Powerful when framed as safety: "We simulated a power outage and checked that every escape route still has enough light for someone to reach the door." Visceral, not abstract.
Verdict
Tier-A for commercial buyers, Tier-C for HDB. Use as a paid add-on / upsell for shop, office, and F&B clients.
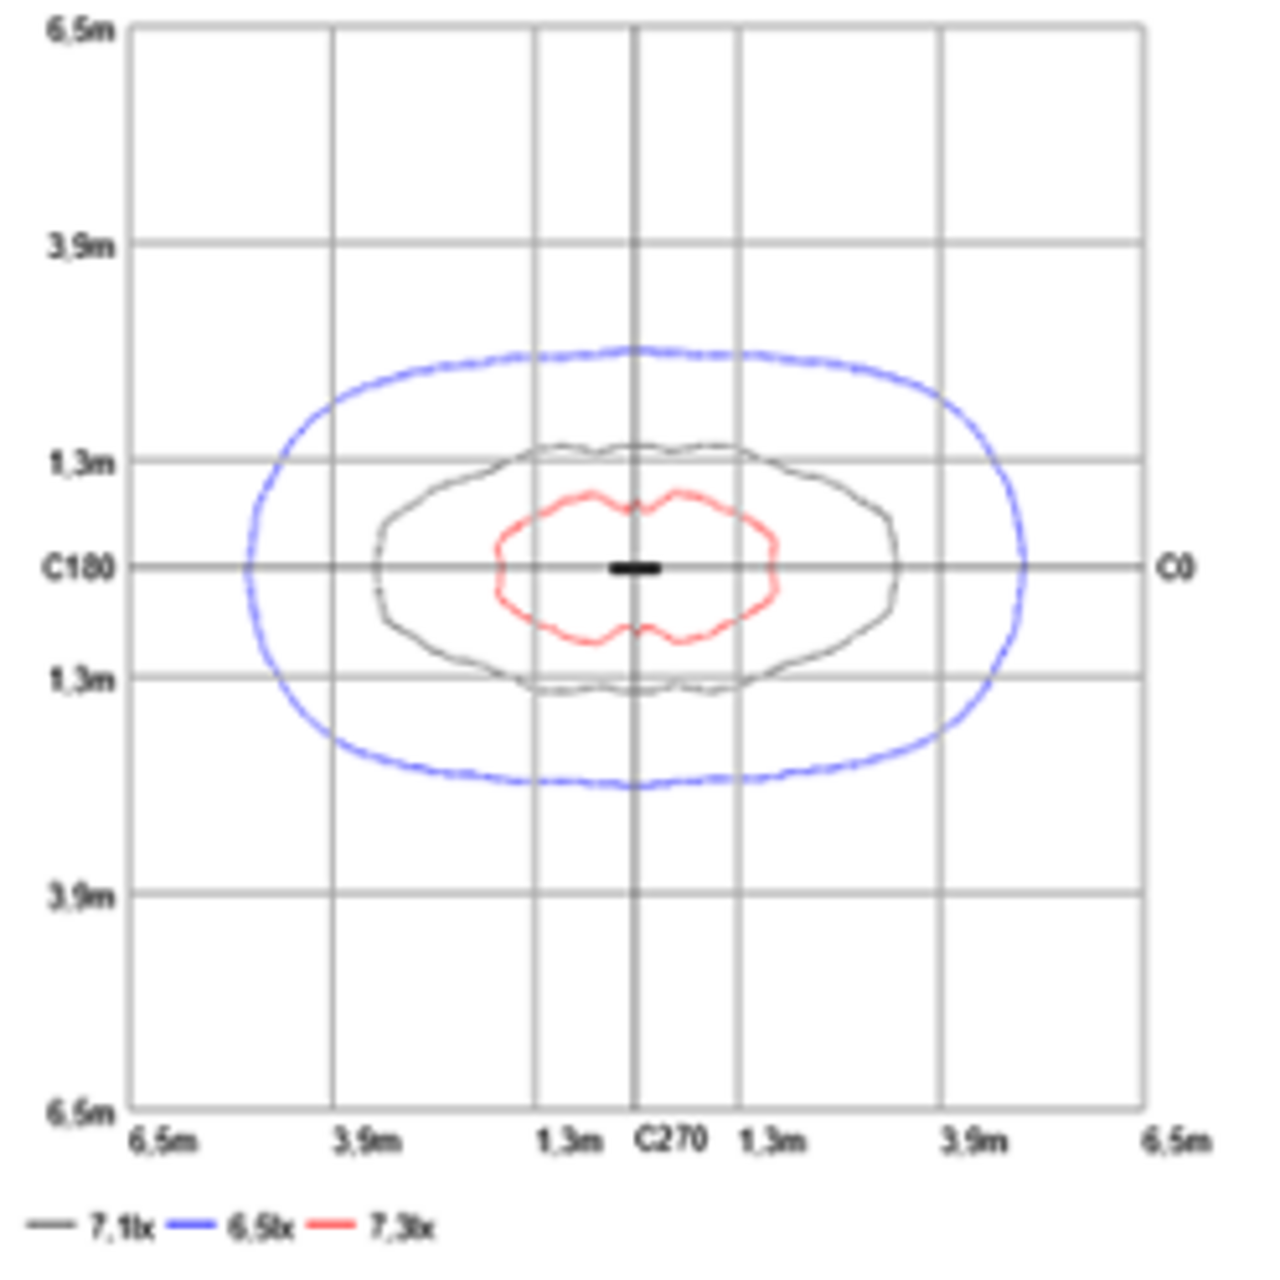
Output 10 · The fixture fingerprintPolar, Cartesian, cone & luminance diagrams
Every luminaire imported into DIALux carries its photometric file (.ies or .ldt). DIALux can display this as a polar curve, a Cartesian diagram, a 3D cone or a luminance diagram — the standard images you see on manufacturer datasheets.


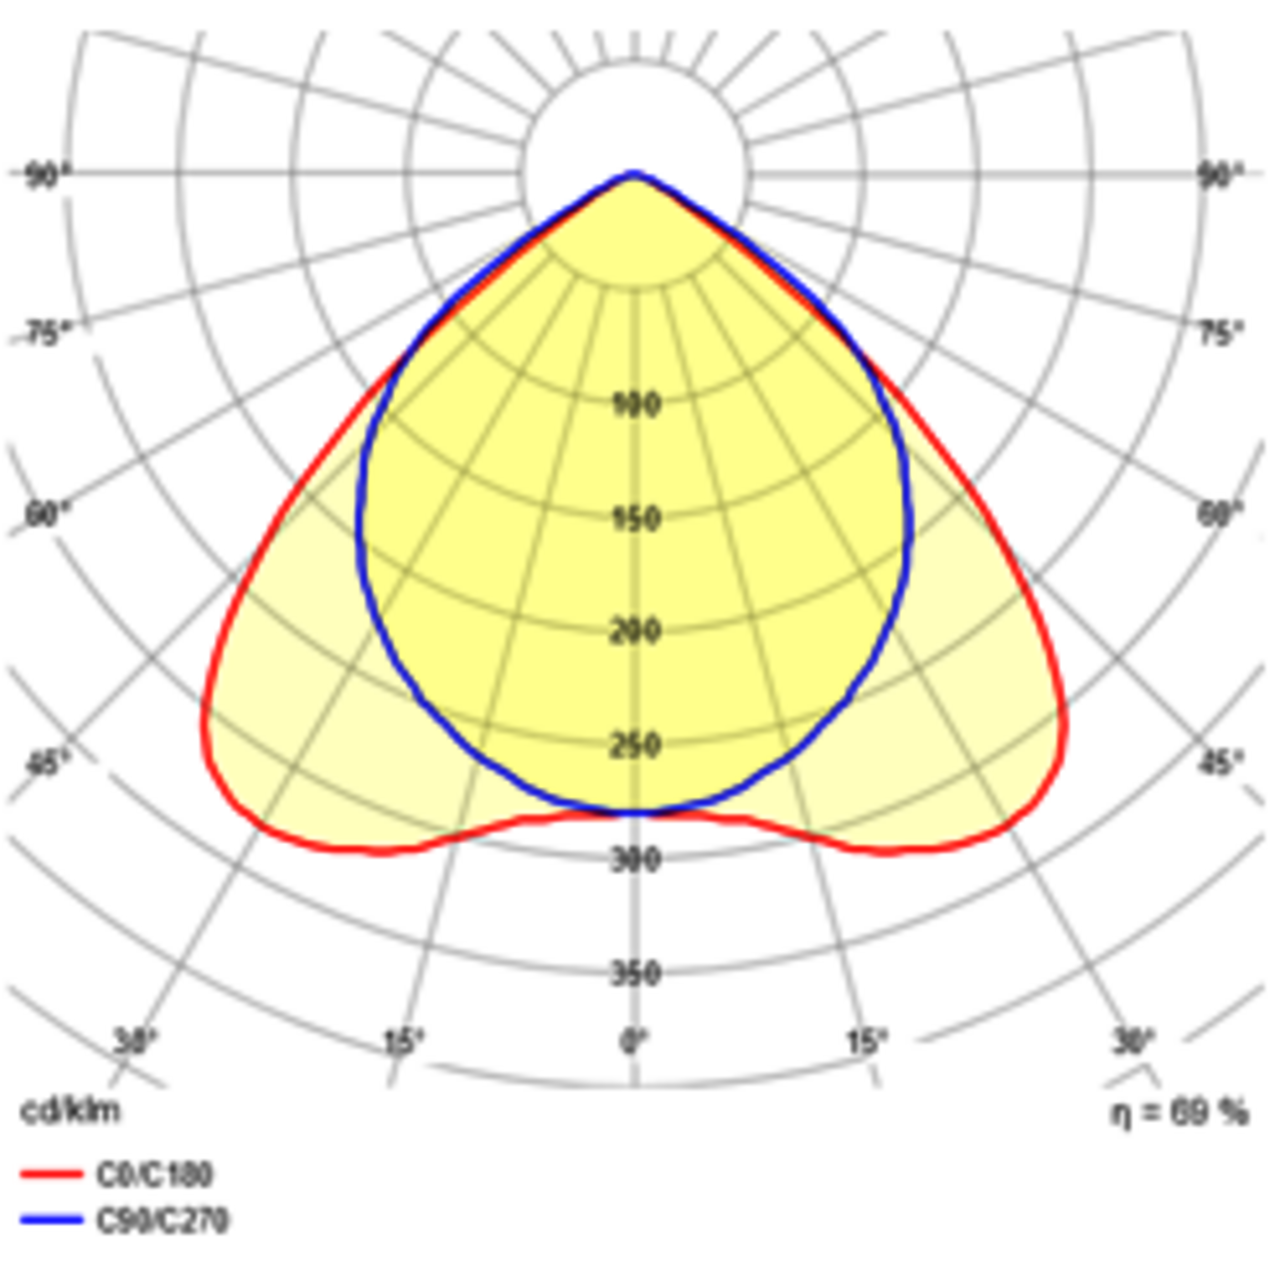
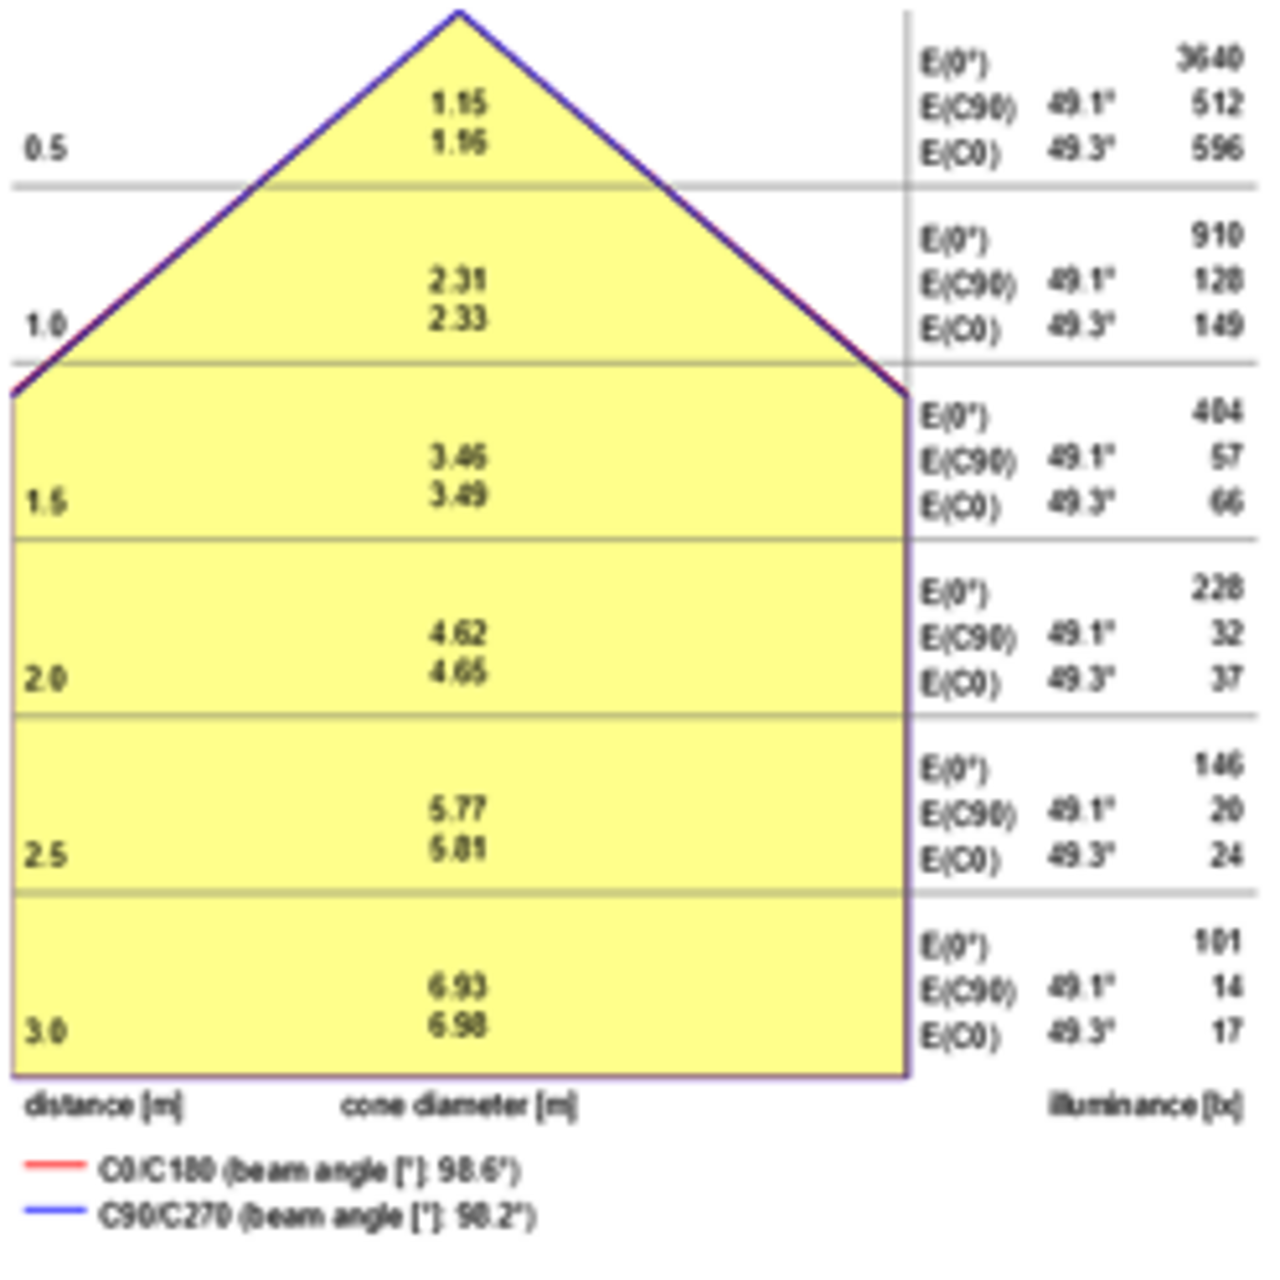
What it measures
The directional distribution of luminous intensity (in candela) emitted by the fixture. Narrow polar curve = spotlight. Wide / batwing curve = office downlight. The diagram is the fingerprint of the optic.
Layperson takeaway
Looks like radar / a butterfly. Most homeowners cannot read it. But a side-by-side cone diagram showing "60° beam covers your whole dining table" vs. "20° beam pools just the centerpiece" lets them pick beam angle without jargon.
Verdict
Tier-B if simplified to "beam-spread illustration" with a sketch of a dining table. Tier-C if shown raw.
Output 11 · The deliverable bundleDocumentation PDF — fixture schedule, room summary, light-scene pages
"Documentation" mode is DIALux's report builder. From a single project you can generate paper or PDF outputs using pre-defined templates: title page, table of contents, luminaire data sheets, room summary, light-scene results, energy summary, custom logo and footer. Customisable per project.


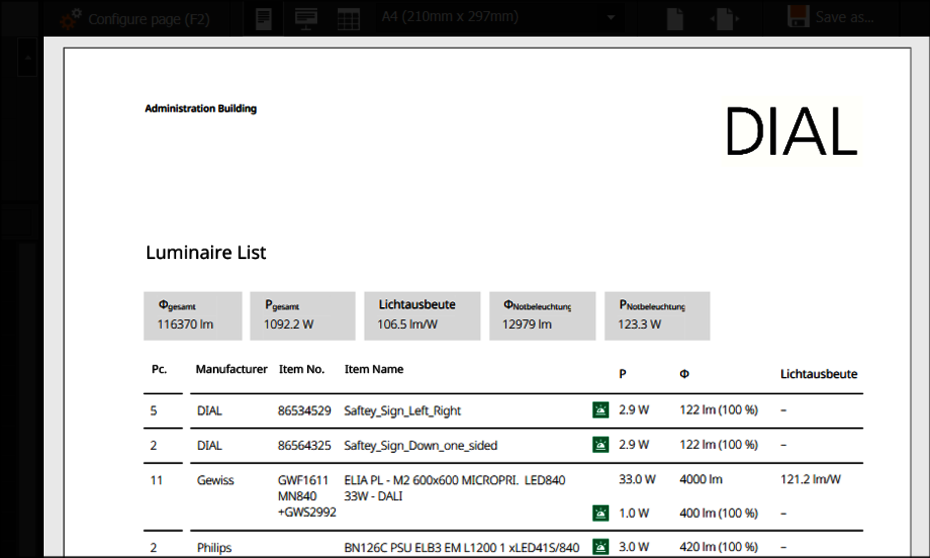

What's inside
Project cover, table of contents, building / storey / room overview, luminaire schedule (data sheets + counts), light-scene results, calculation surfaces with isolines & false colour, energy summary, signature page. Typical residential set: 12–25 pages. Tender pack: 60–120 pages.
Layperson takeaway
A PDF that looks like a Mercedes-quality engineering report. Most homeowners will not read it — but the existence of the document is the point. It signals: "you are getting an engineered design, not a quote scribbled on a brochure."
Verdict
Tier-A as a closer. Send the buyer the cover + 3-page summary + full PDF link. Looks expensive in the inbox.
Output 12 · Outdoor / road complianceRoad / street-lighting outputs (EN 13201)
Specialised module — drop-down of M / C / P road classes, automatic luminaire spacing optimisation, road-surface luminance maps, threshold-increment (TI), surround-ratio (SR), uniformity reports. Most relevant to BSH's commercial / industrial side.


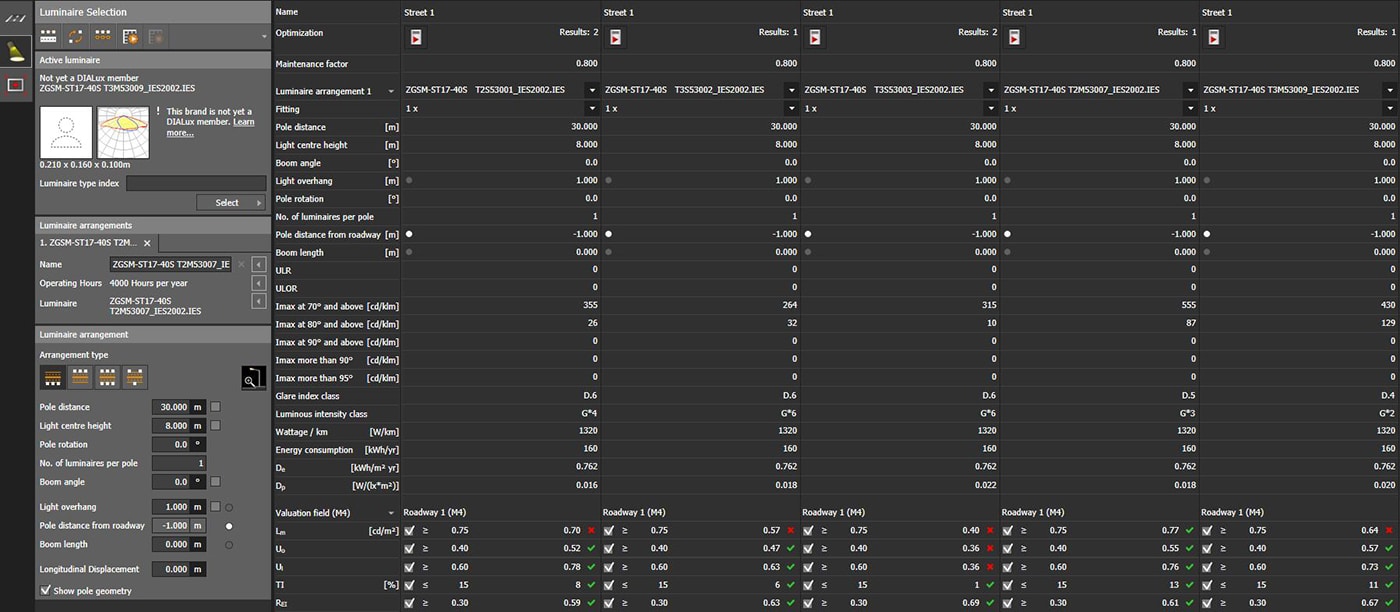
What it measures
EN 13201 road-class compliance: average road luminance Lav (cd/m²), overall uniformity Uo, longitudinal uniformity Ul, threshold increment TI (%), surround ratio SR. Singapore LTA reuses many of these.
Layperson takeaway
Irrelevant to HDB residents. Highly relevant to LTA / town-council / industrial-estate clients.
Verdict
Tier-A for BSH commercial tenders, irrelevant for bshsg.com retail. Park behind a B2B / project enquiry path.
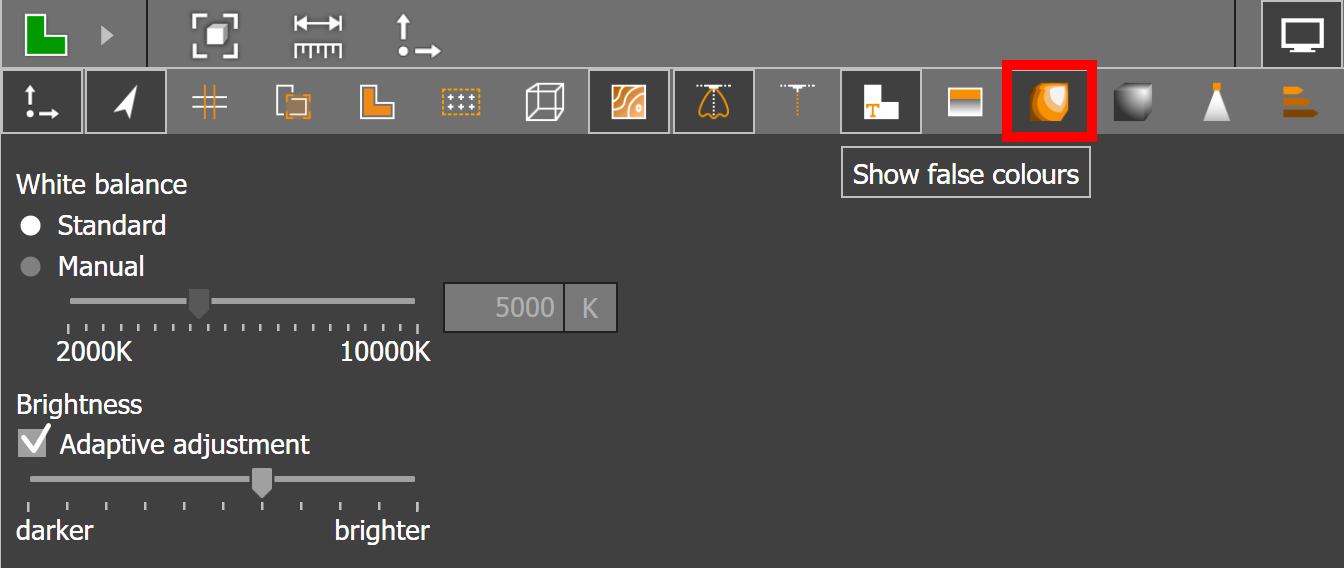
Output 13 · Specialist outputsColour rendering (CRI / TM-30), obtrusive light (evo 13+)
DIALux displays the spectral power distribution of each light source and computes both the general CRI (Ra) and the per-test-colour indices R1–R14. Obtrusive-light (light pollution) was added in evo 13 (2024) — ks glare value, RUL, RDLO, etc., visualised via isolines or false-colour.
What it measures
CRI: 8 reference colours, 0–100 score. R9 (deep red) and R13 (skin tone) are reported separately — critical for residential and retail. Obtrusive light: the share of fixture output that leaks above-horizontal or beyond property line.
Layperson takeaway
CRI = "do my food / clothes / skin look real under this light?" A homeowner intuitively understands the difference between CRI > 95 (food blogger / fashion) and CRI 80 (cheap supermarket). This is the simplest specialist metric to market.
Verdict
CRI/TM-30 — Tier-B, use as a one-line spec on every fixture. Obtrusive-light — Tier-C, niche outdoor only.
SynthesisRanked: which DIALux outputs to show a non-technical Singapore homeowner
Ordered by net buyer-conversion power = (layperson appreciation potential) × (production effort efficiency) × (differentiation from typical Shopee/Lazada fixture listings).
| # | Output | Why it wins (or loses) | bshsg.com placement | Tier |
|---|---|---|---|---|
| 1 | Photoreal raytrace render | The buyer sees their actual room with the chosen fixtures lit at the chosen colour temperature. Replaces guessing from manufacturer stock photos. Hero image of every proposal. | Product page hero, proposal cover, before/after slider | show |
| 2 | False-colour illuminance map | Visceral "I see the dark corner" reading without explaining lux. The single most-engineering deliverable that still reads at first glance. Pairs perfectly with #1. | Right-hand panel of proposal, "show your existing setup too" comparison | show |
| 3 | Documentation PDF bundle | Looks expensive in the inbox. Signals "engineered design, not bargain quote." The signal matters more than the content. | "Download full lighting study (PDF)" CTA, branded BSH cover | show |
| 4 | Daylight factor map | Energy-savings story: "your living room is at 800 lux daylight till 5 pm — you don't need lights on." Particularly strong for west-facing HDBs. | Energy-savings tab, electricity-bill-cut narrative | show |
| 5 | Cone / beam-spread diagram (simplified) | Helps buyers pick beam angle — but only if redrawn with furniture context, not raw polar curve. | Beam-angle picker on product page (interactive) | show |
| 6 | CRI / TM-30 score | Easiest specialist number for homeowners to internalise: "high CRI = food / skin / clothes look real." | Single-line spec, "Why we don't sell CRI < 90" page | show |
| 7 | OpenGL CAD walkthrough (live) | Powerful in a screen-share or showroom kiosk. Not a website artefact. | Showroom kiosk / Zoom-share with a designer | maybe |
| 8 | UGR rosette (with translation) | Glare matters intensely, but the diagram itself is unintuitive. Only worth showing with a "we checked every seat in your room — none of them get blinded" caption. | Office & F&B sub-flow only | maybe |
| 9 | Emergency-lighting layout | Statutory for commercial spaces, irrelevant for HDB. Use as paid add-on for office / F&B / retail leads. | Commercial-tender quote path only | maybe |
| 10 | Isolux contour lines | Same data as false-colour, more confusing for laypeople. Useful only in code-compliance pages of the PDF. | PDF appendix only | skip |
| 11 | Working-plane numerical grid | Wall of 3-digit numbers. Engineers only. | PDF appendix only | skip |
| 12 | Polar curves / Cartesian diagrams (raw) | Looks like radar. Replace with simplified beam-spread illustrations. | Don't surface raw | skip |
| 13 | Surface luminance map (cd/m²) | Unit unfamiliar. Useful as a narrative ("we even simulate perceived brightness") but the map looks like a duplicate of #2. | Narrative only — no map shown | skip |
| 14 | Road / street-lighting outputs | Irrelevant to retail customers entirely. | B2B path only | skip |
Bottom-line BSH recommendation
The bshsg.com "Designed by BSH" proposal page should show three artefacts above the fold: (1) a photoreal raytrace render of the buyer's room, (2) a false-colour illuminance map of the same room, (3) a "download full lighting study (PDF)" call-to-action that delivers the DIALux documentation pack. Daylight factor and CRI become secondary tabs. Everything else — UGR, polar curves, lux grids — stays in the PDF appendix where it carries credibility weight without burdening the buyer to read it.
Sources cited
- DIAL Knowledge Base — Raytracer: evo.support-en.dial.de · raytracer
- DIAL Knowledge Base — False colours: false-colours
- DIAL Knowledge Base — Isolux lines: isolux-lines
- DIAL Knowledge Base — Isolines: isolines
- DIAL Knowledge Base — UGR: UGR
- DIAL Knowledge Base — UGR Method (planning): glare-planning-UGR
- DIAL Knowledge Base — Daylight: daylight
- DIAL Knowledge Base — Daylight factor effective area: daylight-factor-effective-area
- DIAL Knowledge Base — Emergency lighting: emergency-lighting
- DIAL Knowledge Base — Luminous intensity distribution: luminous-intensity-distribution
- DIAL Knowledge Base — Documentation: documentation
- DIAL Knowledge Base — Display options: display-options
- DIAL Knowledge Base — Results overview: results-overview
- DIAL Knowledge Base — Working plane: working-plane
- DIAL Knowledge Base — Luminance L: luminance-L
- DIAL Knowledge Base — Colour rendition: color-rendition
- DIAL Knowledge Base — Street lighting: street-lighting
- dialux.com — Indoor lighting: indoor-lighting
- dialux.com — Outdoor lighting: outdoor-lighting
- dial.de — Emergency lighting with DIALux evo: emergency-lighting press
- dialux.com — DIALux evo product page: dialux
- dialux.com — Obtrusive light evo 13: obtrusive-light
- dialux.com — Light immission evo 13: light-immission
- DIAL Photometry Service: photometry-service
- Behance — Modern Office Lighting Design DIALux evo: behance.net
- Behance — Bedroom Lighting Design DIALux evo (Artem Shevchuk): behance.net
- DIALux community — Living-room render: project-showroom
- DIALux community — Hotel lobby render: project-showroom
- DIALux community — Bathroom render (small bathroom AI-enhanced): project-showroom
- DIALux community — Sumaiya interior renders: project-showroom
- DIALux community — Landscape & façade lighting: project-showroom
- DIALux community — Rendering tip: project-showroom
- Nelca Roco — Top 10 amazing features of DIALux evo: nrocolightingdesigns.com
- Sumaiya Eliyaz — lighting design portfolio: sumaiyaeliyaz.com
- ZGSM — Road lighting simulation by DIALux evo: zgsm-china.com
- DIALux Works (Wordpress blog) — False-color display: dialuxworks
- DIALux Works (Wordpress blog) — Outdoor substation render: dialuxworks
- HighLumen blog — Luminous intensity calculation in DIALux evo: highlumenblog.wordpress.com
- dialux.com — DIALux evo 14 release notes (May 2025): dialux.com
- Inside.lighting — Fixing flawed glare predictions: inside.lighting
- Convert.guru — EVO Converter to MP4: convert.guru
- Lixero — DIALux evo 13 what you need to know: lixero.eu
- Lighting Services Inc — TM-30 explanation: lightingservicesinc.com
- Hochiki Europe — DIALux Basics (PDF): hochikieurope.com
- BEGA — Light distribution curves & illumination diagrams: bega.com